Monday, June 30, 2008

End Game Or Check Mate??? Nifty Recap For The Day!


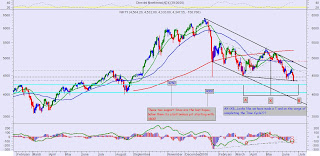
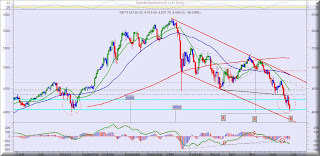
Capitulation! A new word in the lexicon, of newbie’s. Market they say is going crazy, depressing….. Kaput. None of this is true about the market. Market is what it is; it’s just the participants who have gone crazy, depressive and kaput! The search for the bottom is frustrating. For the experienced it’s a matter of patience and for people like me (greenhorn analysts, newbie’s), the search is more akin to the new exploit of Indiana Jones. Maybe we should call it Indiana Jones and the Hunt for the Bottomless Pit. Ironically all the divergences (indicators and oscillators) seem to be failing and all the convergences (crude, inflation, global markets, politics) seem to be working! Maybe we should stop looking for divergences and wait for positive convergences to sail us through. Nifty continued from where it left on Friday. A new low, few more brave bulls sacrificed at the altar. Old bears happy with their hunt, new baby bears born out of this fall, bidding for their moment of glory. The 5 minute chart above shows a steady decline, with every pullback a new shorting opportunity. Daily chart (below) is getting to be more of a challenge. We have made a new low, broke the last barrier 4050. Below that, the red channel suggests a more ominous target of 3750/3800. The only positive signs to provide some solace; MACD histogram still showing positive divergence, the time cycle completes today, and we seemed to have formed a bigger double bottom when taking August 2007 lows into the picture.
The flip side is that barring the global cues we are afflicted with a very fragile political situation which does not augur well for the market. In these circumstances even the best of technical signals fail. Since the Bears have had the successful run in the markets I sum up my post with a word of praise for them;

Fall is graceful and mysterious.
It sneaks up on you like a crisp chill.
It steals the vegetation of life.
As it drifts into the slumber of night.


Chantelle Clark

Hmmm I would have preferred this as a eulogy for bears…but it’s too early for that for the time being!!!

Friday, June 27, 2008

DOWn and bOILing! Nifty Recap For The Day!

The inverse head and shoulders pattern we saw on the hourly charts on yesterday now stands negated, beaten and badly bruised! This also gives us a lesson that chart patterns or indicators are not infallible. PRICE as the say is Supreme! Technically everything was well placed for us (a nice little up move we had envisaged) at yesterday’s close. So what was the story this morning glory? Well for starters we were DOWned on cRUDE shocks. Simply put with DOW bOILing and the global markets weak on the same concerns, we fared no better in the over all picture. In addition we had our Inflation Figures which though rose marginally compared to last week, were still a cause of discomfort. We opened weak as expected, strangely it is not a gap down (technically) nevertheless a very vicious move to the downside in the first few seconds. Rest of the day was spent amidst volatility and trying to protect the lows! On the daily chart we can see that we are still above (4093) the June 25th Low. I wouldn’t say that we have found ourselves THE BOTTOM, maybe its one of the bottoms, to be followed by more. Technically if this holds on Monday then one can be sure of it as a short term swing low and play for a pullback and look for a shorting opportunity near the EMA area. Thus passes another week marred with RED!

JULY: This is one of the peculiarly dangerous months to speculate in stocks. The other are October, January, September, April, November, May, March, June, December, August, and February.

Mark Twain

Thursday, June 26, 2008

A lesson In Patterns!

The above chart is sent by a close friend Jignesh Patel who is also a learner like me! A nice chart for people who like to work with classical patterns.

Nifty Recap For The Day!!!

Another volatile derivatives expiry behind us. Nifty opened firm, continuing the action from yesterday. We have managed to close in the upper range of intra day action. This rally is more a result of oversold levels than anything else. As traders we should be looking to play these short term swings. Today I have done away with the 5 minute chart and replaced it with hourly chart. The area marked with the dashed ellipse shows a small inverse head and shoulders pattern with an upside target of 4450 for starters. But the first resistance zone is 4360 and it looks strong! On the downside we need to protect 4225/4230 (failing to do so would result in some panic and bottom testing). Looking at the daily chart, we can see, all the three indicators (MACD, STOCH and RSI) suggest a buy. The price is extended from the EMA’s and need to pull back and go back to the value area (this is also the target of the inv h&S we see on hourly charts). Now the caveat; tomorrow we have our Inflation numbers. Plus with the weekend coming up traders might be not comfortable in taking longs home since we are still faced with some uncertainty regarding the fate of our government vis a vis the civilian nuclear deal. Assuming we react negatively to Inflation figures and still manage to hold 4225/30 then that would be an ideal entry for going long but I would suggest to play small and play well!

There are two times in a man's life when he should not speculate: when he can't afford it and when he can.
Mark Twain.

Wednesday, June 25, 2008

There Is But Little Hope for Slaves of Fortune! Nifty Recap For The Day!

There is but little hope for slaves of fortune,
Who will not share their failures with their will.
Mastered by the wind, they blame their portion
On chance, which sets their course for good or ill.
But one’s bad luck fits snug on who one is;
One’s fortune is the lyrics of one’s song.

Yeah….just tryin2impress here with a poetic interlude (the above lines are written by Nicholas Gordon)! I am neither congratulating the Bulls nor berating the Bears because I am myself lost and confused about my role in the whole scenario and I hate to be a pig waiting to be slaughtered! Nevertheless we all indeed are Slaves Of Fortune! Nifty’s open was expected following weak overnight cues from the world markets plus a CRR and Repo hike by RBI. Equally surprising was the way this news was taken into the stride and with a little help from strong Asian markets and a firm opening in European bourses we had ourselves a nice trending day but filled with lot of spasmodic reactions. For every analyst worth his salt this rally was expected because of oversold levels, and it suggested a relief from the red we were so accustomed to seeing for last one week. Normally we can’t predict the market behaviour but today Nifty did favor the brave albeit temporarily, and then it confused the novices with NOISE. On the daily chart we have closed above the psychological level of 4250 and if there are no nasty surprises (wishful thinking!) we should see 4350/60. Having said this we must consider some external factors like important Fed meet and tomorrow being the derivatives expiry for us. Also a cause of concern is our very own Left Oscillator (Nuke Deal), which has started to swing wildly!

Monday, June 23, 2008

Nifty Recap For The Day!!!

I am a bit pressed for time so want to make this post very brief (anyway yesterday’s post on Nifty was kinda definitive). Nifty opened where it had stopped on Friday. Set amidst volatility and confusing signals we drifted lower and Yes we did poke 4250! On the intraday chart we came back to test the bottom and then got a clear signal to go long with simultaneous breaking of the trend line and the falling 20 period SMA. I would call today’s action that, of subdued optimism. With so many important meetings scheduled for this week market participants are hesitant to take a confirmed call. It’s not easier for the day traders either but they are getting a few opportunities to scalp and once again only the nimble are making money. On the daily chart we can see that we have penetrated and closed above 4250. If this along with today’s low is held then we might see some respite. On the flip side this penetration of 4250 has opened a few more gates to the downside!!!

Que Sera Sera!!!!

Sunday, June 22, 2008

Ramblings Of An Insane Mind! A Bit of Nifty Analysis Too!!!


Had a little time this weekend so thought why not delve deeper into Nifty? The first two charts above are that of monthly and weekly time frame. Both of them have been adequately marked. The Head and Shoulders on the weekly have some ominous targets which I believe are too far fetched. But then a friend pointed out take a peak at the historical chart of Nikkei and nothing will seem far fetched after that! They plummeted from 40k to 10k! Scary??? Can’t help it that’s the way the market goes and it surprises most of the participants. Below are the daily and hourly charts. So far technically the first line of defense is 4250 and below that 4050. Going even deeper you get 3800 and further below we have….forget it, this is giving me a sinking feeling and nausea so we better be content at 4250 and something below that for now! For some solace we should apply Newton here “For every action there is an equal and opposite reaction”. So if this is the reaction to the bullish action we had witnessed then we will also have reactions to this bearish move maybe some fast reversals and pull backs worth trading! As I always say Hope springs eternal in a bull’s heart!


Technically the markets will react the way they ought to react but sometimes in between we have certain anomalies which result in more skewed reactions albeit temporary. But these reactions are violent enough to shake quite a few people or let’s say majority of people. I am talking here about some external factors we are faced with. You see the cRUDE shocks and rising Inflation are a part of life and they are people intelligent enough to tackle them. It is only when politics starts interfering with economics this produces a heady cocktail that the Markets abhor. For us we have a few more indicators and oscillators to watch while we trade in Nifty;

1. Left Oscillator: The Left is an important part of our coalition government. But they have been oscillating violently (stochastics behaves much better!) between support and withdraw support. Damn it’s very difficult to pin point there OB and OS levels!!!

2. Nuke Deal: Here again Left is playing a role of nuking the government rather than having a Nuke deal with the U.S Of A. This is more like a falling moving average providing resistance on the up move!

3. Inflation: This is more like a sentiment indicator. It elicits spasmodic reactions in the end it is quickly forgotten till next Friday when new set of numbers are released!

4. Political Hullabaloo: This is more of an Open Interest scenario. Yeah every political party or rather every leader (here the leaders are bigger than the party!) has his own open interest. This goes up and down with the spoils he can lay his hands on.

Who said trading Nifty was easy? Apart from classic technical techniques you need to keep the above mentioned also in mind because they are the culprits which might result in the draw down in your account!

Saturday, June 21, 2008

My First Attempt To Read Crude!!!!

I am making an attempt to study the chart of Crude! I feel Crude is one chart now days that spooks a lot of analysts and most of the time its just going in the opposite direction than anticipated. I too decided to give it a shot…well if you are going to learn Technical Analysis might as well also take a dig at the most difficult market to anticipate.

Let us first take a look at the weekly chart on your left. On the price we can see we had made a little hammer (also an inside bar) which is also a part of bearish Harami (though not a potent one). Then this week we have closed with a DOJI signifying some confusion. This confusion might be due to OPEC meet coming up and also the Saudi initiative to increase production, hinting that the present price of Crude is not rational (but then when are the markets ever rational!). With China also upping the price of petrol to curb its voracious appetite, might result in some lack of demand. Technically the prices are overstretched above their EMA’s and are likely to snap back as they have doe in the past.

On the daily chart we have very interesting or rather intriguing set up. The price is at the value area and suggests another move up as it has done in the past. This time the indicators below present a wee bit different picture. We have clear negative divergence on all the three indicators below; the RSI, the STOCHASTICS and the MACD. Surprisingly this time STOCHASTICS has stayed flat but under the 80 line (area marked by red circle). A failure to close above the May High next week will exhibit some weakness in crude. Whereas the short term trend line looks like a good support (it’s been providing support for last three months!) at 130, it is also a round number support. Below that the next support is 120.

With the given history of crude springing up surprises I shudder to suggest a short here but if one is long then its time to tighten the Stop Loss.

Friday, June 20, 2008

Inflation Deflates Us! Nifty Recap For The Day!!!


So much for positive vibes I was seeing yesterday in the charts. Now I realize what makes Fooled by Randomness (Nassim Taleb) a best seller or for that matter his other book Black Swan! What a day frankly speaking I did expect Inflation a tad lower than 10, thought that the Force will try to keep em under wraps for time being. But we finally or rather this time officially crossed the double figure mark. This gave an excuse for a larger sell off across the board (my darling ONGC bucked the trend!). I guess the traders just don’t want to take anything home on weekends and as for the investors, they feel things might be cheaper in the near future. On the 5 minute chart shown above there isn’t much to understand other than that we just headed south and just like always the 20 period SMA provided resistance to the pullbacks. Though the MACD lines and the histogram traced a bullish divergence but the final conformation was lacking from the Price itself (confirmed signal would be breaking of the trend line and the falling SMA!).

Now taking a look at the daily chart below we have found support at the trend line. I have always seen Technical Analysis as a relative subject. There is a saying in English “Beauty Lies In the Eye Of The Beholder” same way I think every single pattern we infer on the charts is also as good as the person who sees it! For me I see a double bottom marked B1 and B2. I also see a T formation which projects the time cycle where AX=XB. The MACD lines and the Histogram still have not given a signal contrary to what it was yesterday. The fall today was more news based than on technical ground. I assume the pullback would be equally vicious too. On the personal front I avoided the index trade today but did pick up RIL and ONGC. I might wrong in my analysis or I might be right, but at least I have the gratification that I tried.

In fact I once again end this post with a quote I had put in yesterday because I feel it is more apt today considering today’s action and doubts it would have created on many a traders mind!

"A ship in harbor is safe - but that is not what ships are for."

John Shedd

Thursday, June 19, 2008

Nifty Recap For The Day !!!

Nifty opened with a gap down following global cues. Still weighing on our heads is the political uncertainty (this is one thing that coalition government has to live up with everyday!). “Fade the Gap trade” didn’t really take off and we drifted down in a narrow channel. I had earlier mentioned failure to hold on to 4530 will result in 4465. We tried regaining 4530 (we did 4538 at 11 a.m.) and failed. This again reminds us of an old principle of Technical Analysis; supports once penetrated reverse themselves to resistance! Anything below 4450 seriously warrants a look at your nifty longs. On the daily chart, at the risk of sounding too amateurish, I would like to point out that both the MACD Histogram and as well as the MACD lines have a traced a bullish divergence! Also if you take a closer look, then you would notice that the MACD lines are on the verge of giving a bullish crossover. Though armed with these positive signals one must always remember the advice of Martin.J.Pring “Always look at PRICE for confirmation!” I also look positive towards M&M and Telco to give a pullback considering the fact both were beaten down and need to pull themselves back to the value area! All this sounds to good to be true? Maybe it will maybe it wont considering, the fact we have those dreaded Inflation numbers hitting at u tomorrow. The Force is trying to keep em under 10!!!

"A ship in harbor is safe - but that is not what ships are for."

John Shedd

Hmmm…same with the traders…those who paper trade will never learn! Go out and trade albeit with a small quantity…But do Trade!!!

Wednesday, June 18, 2008

Nifty Recap For The Day!!!

It seems neither the bulls nor the bears are sure what stance to take! If at one point the global cues look like to lift us up then are domestic woes pull us down. Maybe there is no trend right now and its only random play going on which is giving opportunity to both the bulls and the bears. That is why a slightest of up move warrants an immediate profit booking, leaving anything on the table looks like foolishness. I had mentioned in my last post that any move forward would make sense if we test the support at 4615/30 (this was major resistance until yesterday) and firm up our ground there. But it cracked! Looking at the five minute chart we can see that Nifty gave a clean short trade once it broke down from the rising channel and also took the 20 period SMA simultaneously. On the daily it looks like two bar reversal. Failure to protect 4530 will result in 4465. As for the upside the resistance remains the same as mentioned yesterday’s post, the only addition is that again we might have to labor at 4615/30!

"If opportunity doesn't knock build a door."

Milton Berle

Tuesday, June 17, 2008

Nifty Recap For The Day!!!

A nice trending day for a change, clean long signal given, and every pullback gave an adding opportunity to existing longs. Oil still spooks with its spikes! Today we had a buoyant feeling because of some news on advance taxes coming in and they seem to be good. The news on monsoon also looks favorable for the time being. A technical bounce was suggested and it happened. We broke out of the resistance 4615/30 and now I feel it is likely to be tested tomorrow for any further advance. On the daily chart the upside looks capped at 4700/4730, as you can see the falling trend line and 20 day SMA are likely to provide some hurdle.

"So long as there is breath in me, that long I will persist. For now I know one of the greatest principles on success; if I persist long enough I will win."

Og Mandino

Monday, June 16, 2008

Nifty Recap For The Day !!!

The resistance we were trying to overcome for the last 5 days was overcome today with another gap up. Nifty opened firm following a good closing of DOW on Friday, and strong Asian markets. But then that was that! After the initial impetus we just didn’t have the strength or rather any conviction to move up. On the five minute chart you can see after making a double top we just drifted in a downward channel. Like I had mentioned earlier on Friday that 4615/30 is the area we’ve had multiple bottoms which are now posing a strong resistance (incidentally the 13 day SMA is also at4627)! Nothing changed much in the daily chart either. Our immediate support looks like 4530 and below that 4550/60. All the action now will be dependent on global cues and of course we have to take into consideration the cRUDE SHOCKS!!!

By the way ONGC did reach 873 today, (yesterday I had mentioned short term target at 875/80) I covered my long at 860 and couldn’t resist myself to get in again at the lows of the day!

"Do what you can, with what you have, where you are!"

Theodore Roosevelt

Sunday, June 15, 2008

ONGC!!!

ONGC is one of my favorite stocks. This is the only stock I sometimes trade in futures other than Nifty. This is also one of the heavy weights, more often it has cushioned Nifty’s fall but lately it seems to be contributing to it! Well the stock is good unfortunately it is the PSU that the government likes to milk!

Let us look at the chart above;

On the right side we have the weekly chart. It has broken the multi year channel (dashed red lines). It also shows a bearish H&S on the weekly chart and looks about just hanging near the neckline.

On the left is the daily chart. Here one can see that ONGC is rising from the lower channel and trying to get back into the value area (the ema’s). It faces strong resistance at the 940/950 levels. But to reach there it needs to clear 875/880 convincingly!

The reason for 875/80 is because that looks like the short term target on the hourly charts shown below (here also you can see short term positive divergence). Now if you take a look at he chart below on the right side it has ONGC (green line) vis a vis NIFTY (red line) and the RS line (blue) plotted in the bottom. The RS line suggests a temporary sign of strength.

I have entered it at 807 with a target of 870. If tomorrow it manages to close above 850, I will be moving my stop there.

Friday, June 13, 2008

Nifty Recap For The Day!!!

Today was again one of the days where it made sense to sit on the sidelines if you were a Nifty trader nothing much was offered during the day other than few scalping opportunities. We look confused as ever! Well like I mentioned yesterday we would wait for the Inflation figures which were as expected. So no more surprises there also, but what’s of interest, is that the rate of Inflation finally seems to be above the rate of Interest that the banks are offering on short term deposits. So I guess its time for negative returns for some time! On the daily chart we are still struggling where we were so the status quo is preserved for the time being. The bulls need renewed vigor; first to overcome this resistance, and then 4615/4630 levels where we had made multiple bottoms. It is said, in Technical Analysis, the support once broken, reverses it role, and then acts as resistance (guess you knew this!!! but what the heck I was just tryin2showoff here!).

"Life unexamined, is not worth living."

Democritus

hmmm.. similarly Charts unexamined are not worth trading the next day!!!

Thursday, June 12, 2008

Nifty Recap For The Day !!!

Now a days it is becoming more a matter of perception how you interpret news. If the hike in repo rates was considered bad enough then the news of improved IIP numbers negated that bad feeling. I guess the RBI news was discounted to a certain extent by the market participants and it was the improved IIP numbers that set the tone for the day of course aided by good cues from Europe which opens after us. Anyway today intraday action was good. It tested the patience and then rewarded the worthy with a break out! Nifty opened gap down (this was expected with a very weak Dow and hike in repo rates announced yesterday). Anyway this news though bad wasn’t bad enough to warrant a new low. Like I mentioned above the good IIP numbers then did their job. After that it was one steady rise with every pull back to the EMA a buying opportunity. We have closed on the upper end of the intra day range and ironically at the same place which, yesterday, we were trying to breakout from! On the daily chart it looks like we have hammered out a bottom for ourselves. With the Bank Index also giving a bounce from its oversold levels and negating the repo hike it looks like the bullish sentiment is back for some time or should I say it’s back till the Inflation numbers we would be dished tomorrow noon!!! For the people who think we have bottomed out for the year 2008 I have only one thing to say “Hope springs Eternal in a Bulls heart!”

"The best way to predict the future is to create it."

Peter Drucker

Wednesday, June 11, 2008

Nifty Recap For The Day!!!

No new lows, nothing much to do today. Nifty opened firm. Most of the day, we drifted in a 60 point range. Today again looked like a time out day between the bulls and the bears. With neither, conceding ground. If you take a look at the 5 minute chart (I have deliberately chosen to display last three days), you will notice that we encountered resistance at the gap down we had on the 9th June. In the closing hour we again attempted to break this resistance (a small inv hsp) and failed. Now looking at the broader picture we seem to have formed a bigger inverse HSP spanning last three days. Incidentally the neckline appears to be the same as the gap down resistance I spoke about earlier. There is all likely hood that this would be taken out tomorrow (if everything is sane around us during the night!) with a gap up. In such a scenario I would ideally like to fade that gap up with my target as the neckline. On the daily chart as well as the 5 minute chart the overhead move should find itself not welcome beyond 4600/4625. On the downside, immediate support lies at 4450.

"Aerodynamically the bumblebee shouldn't be able to fly, but the bumblebee doesn't know that so it goes on flying anyway."

Mary Kay Ash

Tuesday, June 10, 2008

Nifty Recap For The Day!!!

Hic hic it’s late for today’s post. Not my fault, a friend just returned from US and bought a bottle of Jim Beam. This was my first fling with US bourbon and I kinda liked it (Cheers!). So this post can, or rather should, be excused as ramblings of an insane (drunk) mind. We opened weak and made the lows for the year! Damn one more number (4369) now to watch out for. Nifty drifted down, every pull back was met with resistance at the 20 EMA. During the last hour we did get a very low risk trade in nifty long. We broke out of the falling trend line (it does look like a channel too!). This was accompanied by the break above the 20 EMA and this was further confirmed by bullish divergence on the MACD histogram as well as the MACD lines. On the Daily chart we have made a sort of a hammer. This action only points out in two directions;

  1. The bears had the will to take the prices lower but lacked the conviction to stay put there; or
  2. This is just another fishing expedition by the bears to lure baby bulls (like me) into complacency and fool with randomness!

With my limited gray cells and understanding of the markets I am thoroughly confused and would like to take the most difficult way out….yeah just tryin2sit on cash for few days!!! Till then Jim Beams is not bad for company…Cheers!!!

Monday, June 9, 2008

ICICI BANK ....Interestingly Poised!!!

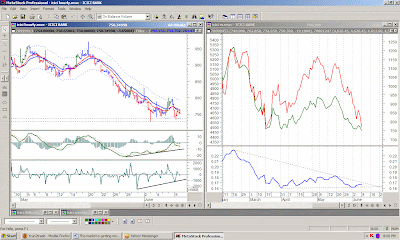
ICICI BANK (ICICI) is also poised for an interesting play. First take a peak the weekly chart. We have an H&S shoulder formation with a drooping neckline. ICICI on weekly has also penetrated its multi year trend line drawn from lows of 2002. On the daily chart we have what looks like an inverted cup and handle! Now take a look at the hourly chart below. Along with it on the right is Relative Strength Comparative of ICICI with Nifty. The daily and the hourly charts show positive divergence and hint of a short term pull back. The RS line also indicating a positive bias. On the negative front ICICI is on the verge of breakdown if it fails to sustain 680/700 levels on closing basis.

Reliance On Sticky Wicket!!!


Reliance (RIL) is very critically poised. Let us take a look at the daily and the weekly charts of RIL. On the weekly chart RIL has broken a multi year trend line, and closed below it. It is also trading below its 13 and 26 week EMA. On the daily chart it has formed a rounding top from mid march till now. Same can be seen on the hourly charts below. 2100 for now is lifeline for RIL. A short term technical bounce from here cannot be ruled out (positive divergence on hourly charts). I make this assumption because it is already trading on the lower channel and far away from its value area (the EMA’s) and is bound to be pulled back there. In fact this pull back can be a good shorting opportunity. On the flip side breaking 2100 on weekly basis opens further downside to 1800 and 1600.

Nifty Recap For The Day!!!

This opening was expected considering the fact that Dow was butchered on Friday and surging crude price. The effect was global and most of the Asian markets also followed suit. We were no exception. The only difference was that over the weekend most of the people were rambling something about Black Monday and lower circuits etc. We did fall but lower circuits?? Na not yet! You see the difference between the fall we had in January and now are that the former was more a culmination of euphoric rally where many participants were caught on the wrong side. Adding to their woes were margin calls which did more damage to the accounts and some were wiped off completely. In this fall we are seeing gradual decline and most due to the selling in the cash market and lack of any buying conviction. Now moving on to today’s Nifty action. Like I said we just opened inline with global cues. It remains to be seen what will be the follow through of this move, considering the fact today was more of a domino effect. We have pricked the lower support levels and now it needs to be seen weather this prick will hold or break the ground below. If the overnight cues get to be positive then one should use the rally to book profits and stay on the sidelines. If Nifty spot trades comfortably above 4530 then one can take a small long position with a tight stop loss at 4500 and play the intraday strength (pullback).

"You may be disappointed if you fail, but you are doomed if you don't try."

Beverly Sills

Friday, June 6, 2008

Nifty Recap For The Day !!!

Another roller coaster ride today! If yesterday was a positive reversal bar then today it is the negative reversal bar. Nifty opened inline with yesterdays close and the global cues were great too! But since we get our Inflation figures every Friday, we moved in a tight range till 12 p.m. No major impact of the numbers as it seems the market is discounting these figures but what it is looking for is the broader implication of these figures. Any way if you take a look at the 5 minute chart we seemed to have made a very nice rounding bottom for ourselves in the first half of the day. And if you look carefully at this formation in conjunction with the last three days action (5 minute chart) then this rounding bottom was the right shoulder in our inverse H&S. This formation would have got many a people excited and lured them to take a long position in anticipation of a breakout. But as they say it’s not over till it’s over….the price never broke the neckline and reversed. It is also said when a pattern fails then the move in the opposite direction is very fast and severe. Once again 4620/30 had a role to play and we took support there for the day. On the daily the ADX is getting aggressive. As of now the high of today and the low of yesterday hold the key to the further direction of Nifty.

"The less effort, the faster and more powerful you will be."

Bruce Lee

Hmm no wonder the stocks fall with a very little effort and the fall is powerful!!!

Thursday, June 5, 2008

Nifty Recap For The Day !!!

So we did have our little pullback. But this was after much mid day drama. Nifty opened flat. We took our first swipe at 4620/30 level (roles reversed the support till yesterday became resistance for now). After the second failed attempt to penetrate we tested the days low and then broke below and proceeded to make a new low for us. Incidentally this was happening when news of Prime Minister resigning were flying thick in various chat rooms and forums. This created a panic among the retail traders and the professionals had a field day in their fishing expedition. This particular move kicked both the weak shorts and weak longs. With a positive cue from European market, Nifty proceeded to complete an inverse H&S and finally broke out of the 4620/30 congestion to close on the higher ground. On the daily chart we can call this a Piercing Candle and for the people who follow bar charts this can be termed as Positive Reversal bar. The low of this bar assumes a lot of significance as any negation of this bar will lead to a severe fall. A retest of 4620/30 is not ruled out for tomorrow. On the up side we have strong resistance at 4730/70. It might be a volatile session and much awaited Inflation figures at 12 p.m. will set the tone for the day.

"Do not confuse motion and progress. A rocking horse keeps moving but does not make any progress."

Alfred Montpert

Is this just a motion in nifty or progress????

Wednesday, June 4, 2008

Nifty Recap for The Day!!!

Poor Nifty “Lows to lows, dust to dust if inflation doesn’t get her Left must”. This is what happened today! The government decided to bell the cat and hike the much needed oil prices. Tough choice in an election year, with their coalition partner (THE LEFT) denouncing the hike and announcing week long strikes (these are nothing but paid holidays!) things aint going to be easy. You see the market doesn’t like uncertainty and most important it doesn’t like government meddling too much. Now moving on to today’s action; Nifty opened firm and was list less till about 12 p.m. when that all important news announcement came. It looked the market had already discounted this news of price hike (it was just waiting to see what percentage the hike would be). There was a sharp spike and then news of Left (usual blah blah!!!) all over the channels. Technically we retraced and failed to claim the highs. The small little M you see on your 5 minute chart did the initial damage and after that it was domino effect. The 4625 which we had so assiduously protected yesterday also went for a song. This is a place where the system now has built many shorts (in fact these are new aka weak shorts). Any positive trigger will make these shorts scurrying for cover, which in short will be a pull back rally. Another important observation is that our man ADX seems to have woken up and stealthily moving up. For now this signals the strength of this down move is getting stronger.

Below is the chart of Reliance (courtesy Shiree Mamgain); this shows the 2B set up from trader vic’s book I had earlier posted in my blog titled Little Trend Line Trick. See how this simple set up gave a very good trade!!!

"Experience is what you get when you don't get what you want."

Dan Stanford

Hmmm that’s why I was wondering what I was getting when I wasn’t getting money in trading; EXPERIENCE!!!!

Tuesday, June 3, 2008

Profit From SHORT Trades! But How????

There is something I don’t like about Indian markets. They seem to be lop sided. In fact most of us our sub consciously forced to look for longs even if the overall trend is down. We the retailers are not allowed to short in cash and carry our shorts overnight (shorting in cash is allowed only for intra day and has to be covered by 3 p.m.). So even if we our very sure of our short trade we have two choices;

  1. Play those shorts in intraday and risk getting stopped out or whipsawed and close them by the end of day and thank our lucky stars if we have made money. Start over again the next day, short and again cover by 3 p.m. and continue to trade this way, till we see a reversal in our daily chart that shorting is no longer fruitful.
  2. Play those shorts in FNO (provided the scrip you have decided to short is there in the fno segment). Short futures or sell calls or buy puts whatever.

Here lies the catch you see. We always advise the new traders to stay away from day trading and avoiding leveraged trades. So you either need a very sound money management system coupled with through knowledge of TA and iron discipline or very deep pockets to withstand margin calls as and when required. Assuming that we are going to enter into a bear market, then this has a very devastating effect on the new traders or small traders;

    • If they avoid day trading and Futures & Options trading they wont be able to profit from the short side of the market. If at all they decide otherwise, then FNO and leveraged trading will wipe them off because most of them operate with meager accounts (this is what happened in January, the fall was accentuated when suddenly the brokerages started squaring of clients’ positions for want of margin money!).
    • The other is to go long in delivery stocks. This again is not a simple thing because to choose the long trades when overall market is bearish is like finding a needle in haystack.

In the end it all boils down to;

1. Fight against odds and go long in bear markets!

2. Play only intraday shorts and cover by 3 p.m. every day!

3. Cross your heart and hope to die (eventually that’s what will happen to you!) and plunge into the FNO trades.

All of the above three are going to kill you! So what do we do? Where do we run? Just HOW DO WE TRADE??????

If any of my fellow readers have experienced the same dilemma then please do come forth with your suggestions and share your views!

Nifty Recap For The Day !!!

We had a gap down today; this was expected since we had closed yesterday at the bottom of the intra day range. Plus the overnight cues from the Dow and the Asian markets were also pretty bad! Yesterday I had mentioned that 4620 is very crucial for the time being and we might witness some volatility there. Nifty opened gap down proceeded to make new lows. By the time Europe opened we were finished with making our base and started our laborious journey towards closing the gap. We finished the day with a little hammer on our hands. I would attribute this to short covering and not any fresh bargain buying. It looks like, now we have 4600 and 4800 levels, marked for play. Both need to be taken out decisively to further decide the direction of the trend. Index trading is becoming a little difficult, wiser would be to keep an eye on sector rotation and look to go longs in strong sectors.

"Problems cannot be solved at the same level of awareness that created them."

Albert Einstein

Hmm we need to go below 4620 to resolve that 4800 was no real support, or we need to go to 5000 to resolve that 4800 was indeed a strong support! I am saying this just because Einstien said we cant have same level of awareness!

Monday, June 2, 2008

Nifty Recap For The Day !!!

Wham bam thanks mam ..oops I meant thanks Nifty! We opened alright but then decided the way up is not for us. With a little help shove from the politicos, rest was easy; we fell on our own weight. With most of the triggers having dried up, all we needed was a threat to the ruling coalition and an uncertainty of early elections. Adding to the woes was a weak opening in Europe; the rest as they say is history (nevertheless a fantastic and a clean short in intra day play). I had advocated a small long at 4840 levels with a very tight; I repeat very tight stop loss a wee below 4800. It was better to be wrong and safe than to be wrong and sorry. On the hindsight 4800 now looked like a mirage; a false hope. It was just not expected that 4800 would break for a song. On the daily chart, 4600/4620 seems to be the only hope for the bulls. We might witness harsher volatility there, because below that, the bottom looks endless with the first halt at January lows. Like I said earlier we have run out of all triggers now we would be moving solely on basis of global cues or on our government efforts in trying to make better sense of economics while keeping the coalition intact. Anyway these are just explanations to keep one self happy. In throes of our irrational exuberance we fail to see the underlying internals of the market. The bitter truth is also that if you view weekly charts of some of the indexes and heavy weights, you would see most of them are in the process of making HSP tops. Well as the saying goes “when in doubt stay out”; maybe this is really the time to stay out and let the dust settle a bit. Damn…this is the hardest thing to do….I wonder why we are so allergic to keep cash in hand? In fact these are the times when we not only loose the cash we loose the hand too! I am myself tryin2control THE URGE!!!

"Shoot for the moon. Even if you miss, you'll land among the stars."

Les Brown

this sounds cool to me, if I fail as a trader, maybe I will get a job of being a star analyst on CNBC!!!

Sunday, June 1, 2008

Divis Laboratories!!!

DIVIS on the 60 minute chart looks like to have broken out of a triangle. Though the price is on the upper channel, and hinting at some kind of pull back towards the ema for a perfect entry. On the daily and weekly chart we seemed to have formed an inverse head and shoulder pattern (see the circled area). 1550 looks like good resistance, breaking it with volumes will give the target of 1700+. This looks possible, because as of now pharma is performing vis a vis other sectors.

SBI....Looking For A Quick Pullback!!!

The above picture is of SBI daily/60 minute and weekly charts. On the weekly (extreme right) we have strong support at 1400 on the rising multi year trend line. On the daily and the hourly charts we are making positive divergence. This can give a very nice pull back trade. As further shorting here won’t yield good returns. The price is already near the bottom channel and far away from the value area (the moving averages). If one is already short then it’s the signal to book profits and wait for higher levels to short again if the technicals permit.